What’s better: Dollar-cost averaging or lump-sum investing?
Disclaimer: The below article is for informational purposes only and does not constitute a product recommendation, or taxation or financial advice and should not be relied upon as such. Please check with your adviser or accountant to obtain the correct advice for your situation.
If you’ve read Why I use Sharesight to track my portfolio, then you know I recently started investing. While I am planning to invest for the long-term, I was still a bit deflated that my investment wasn’t doing that great. This is when Andrew Bird, Executive Director and Sharesight shareholder, overheard me discussing it with a colleague, and suggested I consider a dollar cost averaging strategy.
What is Dollar Cost Averaging
Dollar cost averaging (DCA) is a strategy some investors use to reduce risk. It involves investing the same amount of money in a particular investment during regular time intervals. For example, buying $1,000 worth of Apple (NASDAQ:AAPL) shares on the first of each month. With dollar cost averaging, you purchase more shares when the price is low and less when the price is high. This essentially takes away the emotional aspect of investing because you are less concerned about market fluctuations. That might sound counterintuitive to some. After all, this strategy essentially ignores the price of the investment!
How I tested dollar-cost averaging vs. lump-sum investing
I wanted to know if this strategy had its merits. Sharesight proved to be the perfect place to test this given its ASX historical prices go back 20 years. What I did was choose two popular Aussie stocks: BHP (ASX:BHP) and Telstra (ASX:TLS), and an ETF: iShares S&P 500 (ASX:IVV), and I simulated an initial investment on January 1, 2007. I chose this date to incorporate the global financial crisis that took place in 2007-2008.
I created two portfolios: one where I invested $1000 on the first of January each year (roughly $11,000 to date), and one where I invested a lump sum of $11,000 on day 1. For my example I used $10 brokerage fees to keep it simple. This is something you need to keep in mind if you’re making small investments as your brokerage fees could quickly eat away at your returns.
| Portfolio Strategy | Description | Brokerage |
|---|---|---|
| Lump Sum | Invest $11,000 on January 1, 2007 | $30 (3 trades x $10) |
| Dollar Cost Averaging | Invest $1,000 once a year, on the 1st of January starting January 1, 2007 (Total Investment 11 x $1,000 = ~$11,000) | $330 (33 trades x $10) |
The results?
Dollar cost averaging was a clear winner with double the annualised return and an additional $13,691 in my pocket when combining the capital gains and dividends.

A note about dollar cost averaging
Does this mean that dollar cost averaging will always be a winner? No, not necessarily. As mentioned earlier, brokerage fees can take a big bite out of your returns if you are making small investments. Also, you could miss-out on dividends. For example, my lump sum portfolio received $6,440 extra in dividends alone. There might be many other scenarios where a dollar cost averaging strategy works to your disadvantage, and I challenge you to find a combination of investments where it pays off to use the lump sum strategy. Let us know what you discover in the Sharesight Community.
FURTHER READING

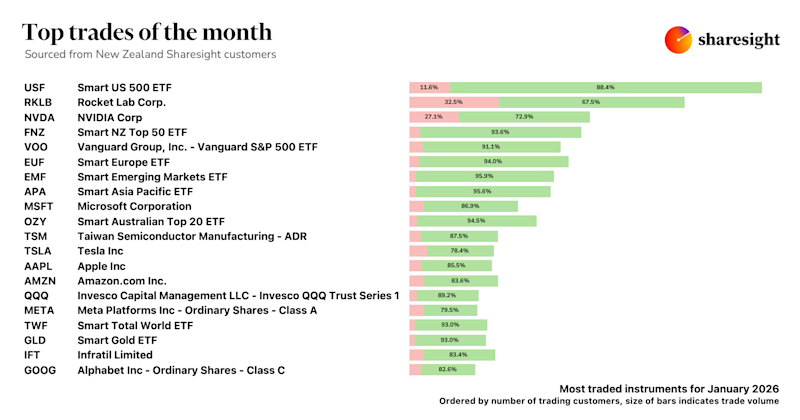
Top trades by New Zealand Sharesight users — January 2026
Welcome to the January 2026 edition of our trading snapshot for New Zealand investors, where we look at the top 20 trades made by New Zealand Sharesight users.

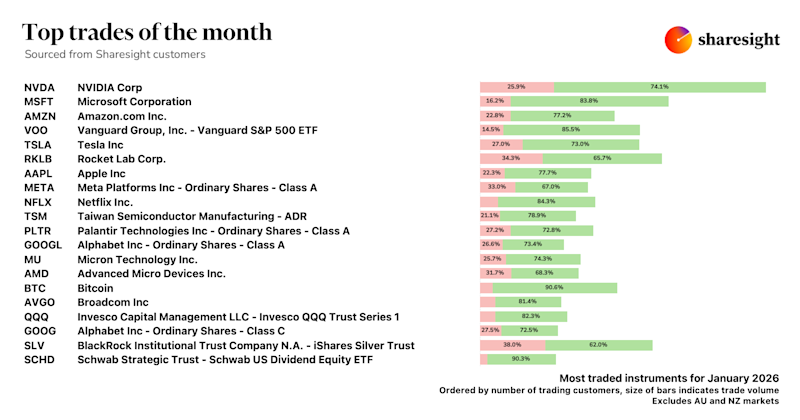
Top trades by global Sharesight users — January 2026
Welcome to the January 2026 edition of Sharesight’s trading snapshot for global investors, where we look at the top 20 trades made by Sharesight users globally.

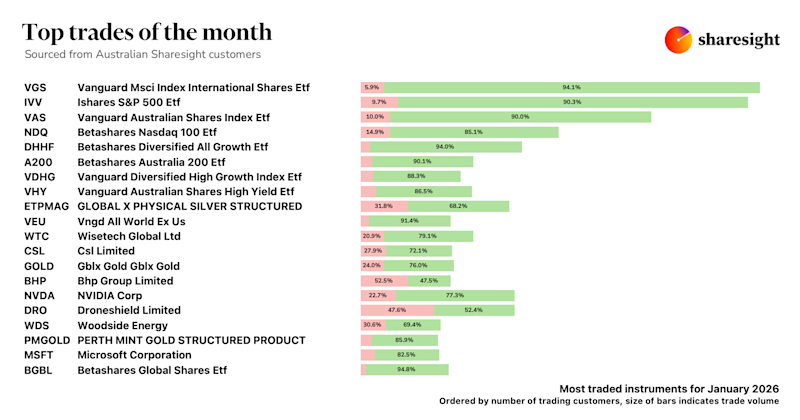
Top trades by Australian Sharesight users — January 2026
Welcome to the January 2026 edition of our trading snapshot for Australian investors, where we look at the top 20 trades made by Australian Sharesight users.