6 key metrics every dividend investor must track
Disclaimer: This article is for informational purposes only and does not constitute a specific product recommendation, or taxation or financial advice and should not be relied upon as such. While we use reasonable endeavours to keep the information up-to-date, we make no representation that any information is accurate or up-to-date. If you choose to make use of the content in this article, you do so at your own risk. To the extent permitted by law, we do not assume any responsibility or liability arising from or connected with your use or reliance on the content on our site. Please check with your adviser or accountant to obtain the correct advice for your situation.
A popular strategy among long-term investors, dividend investing appeals to those looking for a steady stream of income without the need to sell their investments. Some investors may see dividend investing as a ‘set and forget’ type of strategy, but there are actually a number of metrics that dividend investors must track in order to be successful. This blog will explain what those metrics are and how you can track them with Sharesight.
![]()
What is dividend investing?
Dividend investing is a strategy that requires an investor to build a portfolio of dividend-paying assets (such as stocks, mutual funds or exchange-traded funds). The purpose is to earn income simply from holding the assets, rather than selling them. This strategy is often used as a way to generate passive income for investors in their working years, or act as a key source of income to those in retirement. Some investors also choose to subscribe to dividend investment plans (DRPs/DRIPs), which automatically reinvest any dividends they receive back into the asset, often at a reduced price. This allows them to grow their positions in their assets over time, without the need to make any additional buy trades (or pay brokerage fees).
Challenges of dividend investing
As a dividend investor, one of the biggest challenges you will face is keeping track of all the dividends you receive for the various assets in your portfolio. If you have a portfolio with multiple dividend-paying assets, you will likely find that they belong to a number of different share registries or stock transfer agents, which makes it quite tedious to cross-verify the amount declared and paid into your nominated bank account. This is then further complicated if you receive a mixture of paper and digital statements, or if you buy into assets close to the ex-dividend date.
Many dividend investors try to track all of this in a spreadsheet, but that quickly becomes tedious when you have more than one dividend-paying asset in your investment portfolio. The spreadsheet itself is also subject to inaccuracies and incomplete data, and with each passing year, the only thing assured is more time spent gathering data and maintaining the spreadsheet.
The 6 key metrics of dividend investing
It’s important to keep track of some key dividend metrics as guardrails for your portfolio. The following should be part of any dividend investor’s toolkit:
1. Dividend yield
This simply refers to the ratio of dividends to share price, which tells you how much regular income you might get from the assets you own. Dividend yield can be calculated with the following formula: Dividend yield = Annual dividend per share / Current share price
For example, a company that pays a dividend of $5 annual with a current share price of $100 has a dividend yield of 5%.
Using Sharesight to look at the dividend to share price movement for Mirvac (ASX: MGR), for instance, we calculate dividend yield by adding up the two dividend payouts and dividing this by the share price. In this case, the calculation for the dividend payments would be 0.06 + 0.045 = 0.105. The current share price at the time of writing this post is $1.975. The ratio of these numbers is 5.3%.
![]()
It should be noted that in isolation, dividend yield is not a very useful metric. Dividend yields can increase if either the dividend payout increases or if the share price decreases. And if the share price decrease is due to a fundamental issue with the underlying business, then you are buying into an underperforming company. Hence, the term dividend yield trap. For this reason, it’s important to consider the dividend yield in conjunction with a range of other key metrics, which we will discuss below.
2. Dividend payout ratio
This metric measures how much of a company’s earnings (net income) are paid out as a dividend. If this number is too high, it means there is not much room for error in case of a downturn. If it’s too low (like 0%), this is more synonymous with “value investing” than “income investing”, meaning the asset should not be considered a “dividend stock”.
The dividend payout ratio can be calculated using the following formula: Dividend payout ratio = Total dividends / Income
Both the total dividends and the net income of the company will be reported in the company’s financial statements when it releases its earnings report. The dividend payout ratio (on a share basis) is the ratio of the dividends per share by the earnings per share. For example, if a company’s total profits were $100,000, and its dividend is $25,000, then the dividend payout ratio would be 25%.
Unlike the dividend yield above, the dividend payout ratio is not influenced by the current share price.
3. Monthly dividend income
If you’re a dividend income or dividend growth investor, it’s essential to track the value of dividends from your investments over time, especially if you rely on dividend income to fund your lifestyle. If you track your dividends properly, you will have a clear view of how much income your dividend stocks generate.
To view the monthly income generated by your dividends, the first step is to get all your investments into Sharesight, including any investment property and fixed income securities. Using the future income report, you can then change the date filter to see the monthly total dividend, distribution, and any fixed income you have received.
The monthly income breakdown looks like this:
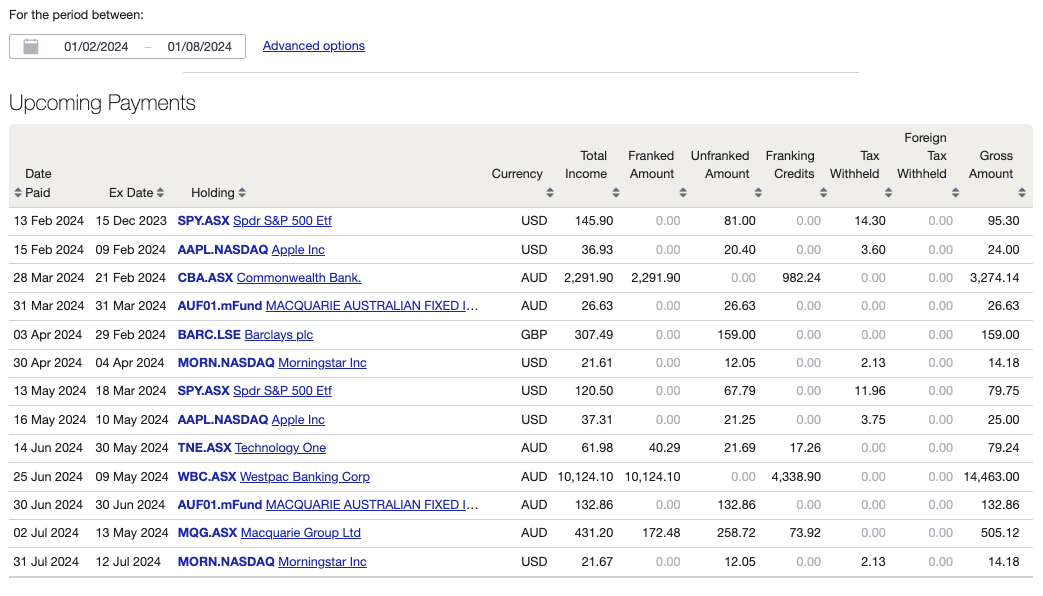
With the future income report, upcoming dividend income is broken down into a range of categories to help you plan your cash flow. To retroactively calculate your monthly dividend income, you can also set the report to a date range in the past.
4. Cost base of DRPs/DRIPs
Dividend reinvestment plans (also known as DRPs or DRIPs) can be a great way to increase exposure to a stock by automatically reinvesting dividends in new shares or units (in the case of ETFs or mutual/managed funds) instead of receiving cash. While it can be advantageous to grow holdings in a company or a fund without having to pay any further brokerage, it does present a record-keeping challenge.
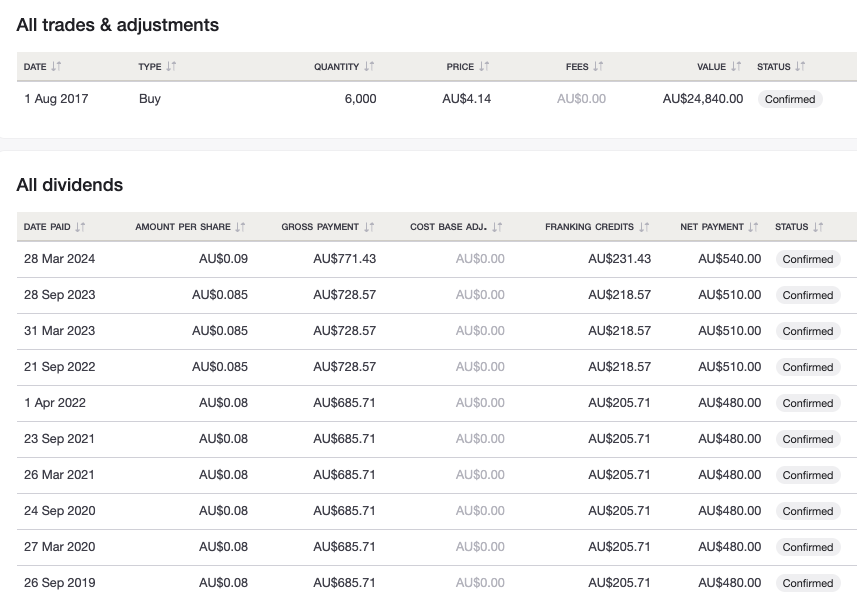
Sharesight helps track DRPs/DRIPs automatically (for ASX and NZX assets), reducing manual admin on your part. For example, as can be seen in the screenshot below, the cost base for every dividend reinvestment is automatically tracked, helping you make accurate tax filing records and decisions.
![]()
5. Franking credits
This is a bonus one for jurisdictions that have dividend imputation tax credits, also known as franking credits (particularly in Australia). As an individual investor, this franking credit entitles you to receive a credit for the tax already paid on this dividend by the company when they complete their tax return. In cases where the tax already paid exceeds the individual’s marginal tax rate, the tax office will refund the difference in cash (under current rules).
Franking credits are automatically tracked with Sharesight. For example, Telstra’s dividends are 100% franked, and Telstra shareholders’ dividend records look something like the example below in Sharesight:
6. Total annualised return
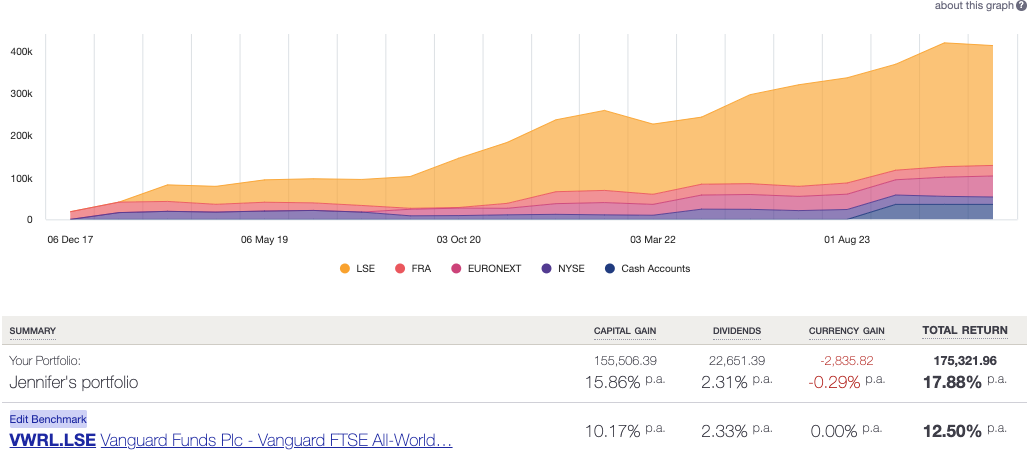
While this is not a pure dividend metric, it’s an important and comprehensive one that tracks the overall performance and health of the portfolio. As you can see from the key drivers of the annualised return, dividend return is just one of the components.
The main components that go into an annualised return are:
- Capital gains
- Dividends and distributions
- Currency fluctuations
- Brokerage costs
- Time
You can see how they come together in the screenshot below. By breaking down the annualised return into these components, it gives you a clear view of which factors are contributing the most to their return, allowing you to make more informed decisions about your portfolio.
Track the impact of dividends on your investment performance
With Sharesight’s advanced dividend tracking and performance reporting features, investors can access unparalleled insights into their investments at the click of a button. With Sharesight investors can:
- Automatically track dividend and distribution income from stocks, ETFs, LICs, and mutual/managed funds – including the value of franking credits
- Use the dividend reinvestment plan (DRPs/DRIPs) feature to track the impact of DRP transactions on your performance (and tax)
- Run powerful reports to calculate your dividend income with the taxable income report
- Easily share access of your portfolio with family members, your accountant, or other financial professionals so they can see the same picture of your investments as you do
Sign up for a free Sharesight account and start tracking the impact of dividends on your investment portfolio today.

FURTHER READING


Why tax time is so painful for family offices — and what to do about it
We discuss five reasons tax time hits family offices harder than it should, and what better infrastructure looks like in each case.


Sharesight product updates – July 2026
This month, we rolled out a new CGT breakdown schedule on the Australian CGT report, expanded cash reporting with multi-currency, per-broker accounts, and more.


Save time and money by sharing your portfolio with your accountant
It's easy to save time and money at tax time by sharing access to your Sharesight portfolio with your accountant. Keep reading to learn more.